Friday, November 30, 2012

Winter 2012-2013 Outlook

As most of my friends are very big skiers/snowboarders, I thought that heading into December, I would give you all a Winter Outlook.

I've been looking at some of the long-term models for this winter and they are all hinting towards a big snow year for the northeast. Take a look at the map I drew below.

This map totally was decked out in colors that you can't see for some reason. But with a near normal El Nino, and a model hinting negative North Atlantic Oscillation, we should expect to see above normal snowfall in the east and down the Appalachians. The Mid-West could see a big storm or two but will be below normal in terms of snow fall. All of the Equal Chances are just areas that could swing either way this winter.

To all of my winter loving friends in the east get your winter gear ready! If you all didn't know winter is my FAVORITE season! I love the snow, cold weather, and to predict the big snow/ice storms!

 If you have any questions on what I look at to do this long term forecasting feel free to ask, I'd be more than happy to share!

Have a fantastic weekend!


Thursday, November 29, 2012

Throwback: The Dust Bowl

Drought is one of the many natural disasters. However, the infinite Dust Bowl, plagued this country's mid section during the worst financial crisis the world has ever seen. From 1930 to 1939, extreme drought was felt on about 80% of American soil. Take a look below at the drought monitor from July 1934 courtesy of the National Weather Service. Twenty-six states were experiencing extreme drought


at this time.  They called it the "Dust Bowl", because not only was it a devastating drought but there was also many dust storm that occurred during this time as well. The people that lived in these areas through this time called these dust storms "black blizzard", because of all the dust and dirt it would bring. I found a photo from the Weather Channel that shows a dust storm that is on the horizon.

Many people left these baldly affected areas during this time to escape these terrible conditions, however they only found that much of the country was experiencing drought as well job scarce.

The "Dust Bowl" was much more than just a drought. There were a couple of factors that went into this natural disaster. Firstly, many didn't have the agricultural knowledge that we have today. These techniques that we now use today include crop rotation, cover crops and ways to prevent wind erosion. This lack of knowledge was the cause of many dust storms throughout the drought.

Another problem that environmentalist claim made the drought even worst was that farmers removed most of the prairie grass that was in place. This grass had deep roots so it wouldn't blow away and also kept some moisture in the soil as well. They say that this was also a large cause in all of the dust storms that occurred.

Although technology can't protect us from droughts, we have learned alot from this horrific event to help generations to aware and prepared.


Wednesday, November 28, 2012

Wacky Weather: Record Setting Tornado Count

In 2012, we've had our hands full with a persistent drought covering most of the country, and not to mention Hurricane Sandy. Both of these big weather events have kept everyone's attention away from severe thunderstorms and tornadoes, which as of right now we are at a record modern era low for the amount of tornadoes in one year. I say modern era because tornado records didn't start until 1950.

The current count for tornadoes this year is 888. And a very large chunk of that number was seen from the beginning of the year through April.

Why so few tornadoes, well the drought in the greater half of the country is to blame. The drought has caused fewer rain showers, thunderstorms, and supercells to form hence less tornadoes formation. There are only a few weeks left, but most scientists are in agreement on ending the year with the least amount of recorded tornadoes.

Photo and Data from:
uvm.edu
ouramazingplanet.com


Tuesday, November 27, 2012

Forecasting 101: Cloud Types

After all the jokes about choosing a profession where you can be wrong all the time and still get paid are settled (which is totally not true by the way). One of the first questions I get when I tell people I'm a meteorologist is what are the clouds outside right now?! Well, I look up put my hand to my chin, look like I'm really trying hard and give them an answer. I love to be dramatic, because I usually know what the clouds are automatically even without looking sometimes, because hello I forecast for a living!

Anyway back to teaching you about the different types of clouds. To start off there are three main types of clouds!

1). Cumulus, literally meaning a heap or pile, is your typical low level cloud. When I say low level I talking about 6,5000 feet in altitude is where these clouds form. As seen in the picture below, a basic Cumulus cloud is associated with fair weather. However, Cumulus can be paired with other cloud

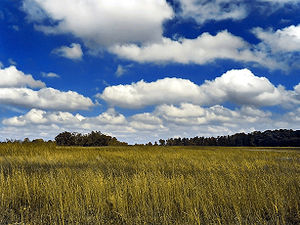
related words like, nimbus meaning precipitating cloud. I'm sure you've heard of cumulonimbus cloud, if not these are your thunderstorm clouds! Cumulus clouds are one of my favorite weather phenomena, because the math on a piece of paper for one of these clouds in quite remarkable. Remarkable, because it looks like it's almost impossible for this to occur in nature, but it does. So cool right!!

2). Stratus, literally meaning is flattened out or covered with a layer, which is exactly what these clouds do. Look at the photo below, this is a picture of a stratus cloud. A stratus cloud is still

considered a low cloud. These clouds are usually associated with light precipitation.

3). Cirrus, which means a lock of hair, are your high clouds. The picture below is a great picture

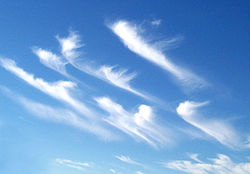
of what these clouds look like. These clouds are usually made of ice crystals because they are so high the the atmosphere.

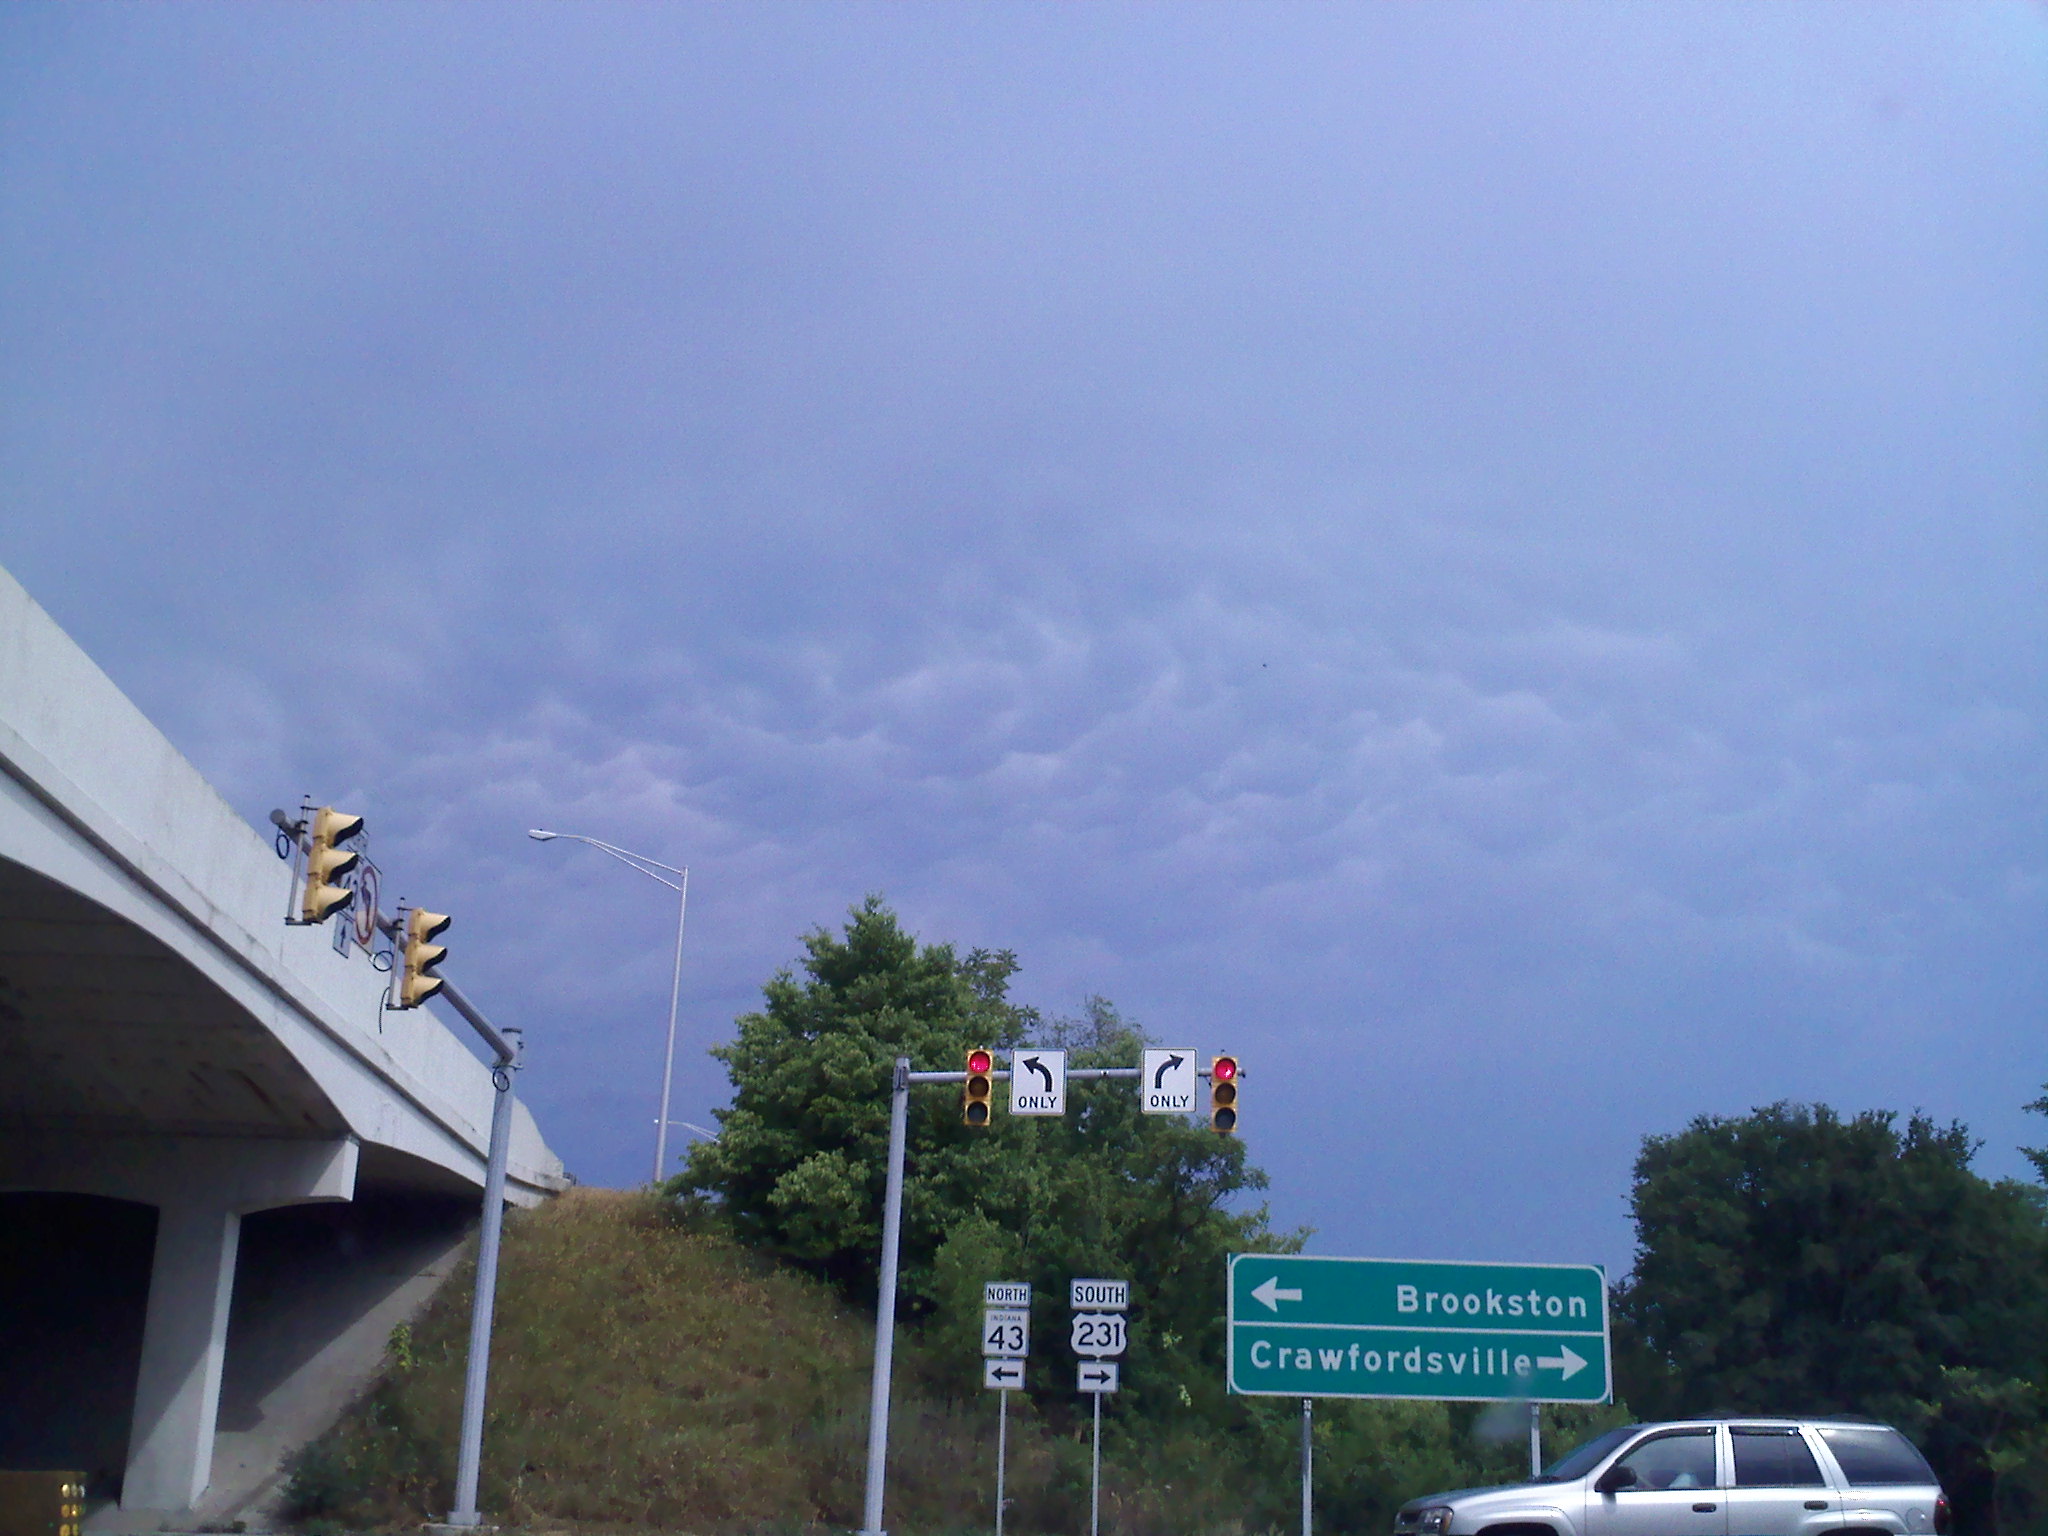
But my take home point from all of these cloud types is when you are drawing clouds, especially cumulus clouds, please draw them with a flat bottom and a round top. It's one of my pet peeves when clouds are all rounded and such. I can only think of one cloud that doesn't have a flat bottom is a Mammatus cloud, which is pictured below. I actually took this photo! If you can see the protruding clouds those are Mammatus clouds. These clouds are usually associated with severe thunderstorms.

If you have any questions feel free to ask!


Photos From:
http://ed101.bu.edu/StudentDoc/Archives/ED101fa09/daisyg/index.html
Wiki.com

Monday, November 26, 2012

Myth: Measursing Temperature by a Cricket Chirp

First of all I hope everyone had a wonderful Thanksgiving! For your Monday after Thanksgiving, we are going to talk about Crickets!

Myth: By counting the amount of times a cricket chirps, this will then correlate to the current temperature outside.

 Result: Yes! May not always be exact but they are usually within one or two degrees of the current temperature.

The Science: The frequency of the cricket chirp can be correlated to the current temperature. The more frequent you hear the chirp outside the warm it is. To get a rough estimate of the current temperature by the frequency of cricket chirps. First count how many chirps you hear in a 15 second time span. Then take that number and add 37 to it. That will give you the temperature outside. Or if you aren't a math wiz just count how many chirps you hear in the 15 minute time span and put that number into the Cricket Converter courtesy of NOAA and it will do the math for you! Who said bugs weren't smart!

Photo From:
littleoldhouse.blogspot.com 


Wednesday, November 21, 2012

Wacky Weather: Africa Flooding

One of the biggest reasons I chose meteorology as a major and a career path is because I get bored with the same ol' song and dance, day in and day out. In meteorology you don't have to look far to find something interesting and if you do you know you have a mundane weather pattern or "nice" weather. Yes, I said it! Almost all meteorologist hate nice weather, because it makes our job easy and boring. Today is one of those days...

For this Wednesday before Thanksgiving, I am bring you to Africa. Many parts of Africa have seen the worst flooding in decades. Niger, Nigeria, and Cameroon have been the hardest hit. These countries are located in the North Western part of Africa. See in the map below.

It has been raining since July, and this excess rain and flooding is due to a very active monsoon. The West African Monsoon usually starts in June or July and continues until about September. However, this year's the monsoon has brought too much moisture and rain for the area to handle. Most of the rain has subsided and the clean up to this devastating flood begins. This flood has taken hundreds of people's lives and many more have lost homes and crops. Remember, that flooding and droughts are the most deadly natural phenomenon not tornadoes and hurricanes. 


Photo From:
eco-friendly-africa-travel.com

Tuesday, November 20, 2012

Forecasting 101: Weather Station Symbols

The next important step in forecasting is looking at the current conditions! Forecasters do that by looking at a Surface Map. Like the one below. This is the surface data from November 19th at 1:07am EST.

Note: All weather things are done on Coordinated Universal Time (UTC), Greenwich Mean Time GMT, or "Z" as most meteorologist refer it as. Basically it is just one more way from them to confuse you if you weren't already, with all of the other conversions. But you get used to it after a while.


All of the tiny symbols are current readings at that particular location. Most are located at airports. I found a great diagram of one from weatherwizkids.com. It breaks down what each element represents. 
 Weather Station
This example above is reading:
Sky Cover: Clear
Pressure: Is Falling and has fallen 6mb from previous reading
Sea-Level Pressure: 1010.7mb
Wind: North Northwest at 15 knots (approx 17mph)
Temp: 57 degrees Fahrenheit
Weather: Moderate Rain Fall
Dew Point: 56 degrees Fahreheit

So after decoding this is kind of a bad example, because you aren't going to have clear skies with moderate rain fall... but hopefully you catch the drift. I've linked up a helpful website I use if I ever have a question about symbols.

Weather Symbols Basics 

All of these readings are super important to a forecaster, because you need to know what going on around you to understand what going to be heading your way. Any question please don't hesitate to ask!

Turkey Day is only two days away!!

Photo From:
weather.rap.ucar.edu

Friday, November 16, 2012

Climate Checker: 5th Globally Warmest October

According to the National Climate Data Center, October 2012 temperature averaged globally the 5th warmest on record. Records of global temperature have been kept since 1880.  The map below show the departure from average temperatures across the globe. Note that shades of red indicate warmer than average and shades of blue are cooler than average.
http://www.ncdc.noaa.gov/sotc/service/global/map-blended-mntp/201210-201210.gif

Have a great weekend!!

Thursday, November 15, 2012

Throwback: The Perfect Storm

In light of recent events on the eastern seaboard with Hurricane Sandy. I thought that I would bring you back to Halloween of 1991. When the Perfect Storm hit New England.


At this time Hurricane Grace had recently formed and was moving up the eastern seaboard. At the same time a very strong low pressure formed off the coast of Nova Scotia and a cold front was moving southward from Canada. As these two storms and this cold interacted they formed "The Perfect Storm" off the coast of New England. This now superstorm moved backwards over warm waters in the Gulf Stream, as it did it brought high winds, large storm surge, and excess of rain to New England. Northern Massachusetts saw extensive damage from this storm.

Wind Reports:
Chatham, MA - 78 mph
Thatcher Island, MA - 74 mph
Marblehead, MA - 68
Newport, RI - 63

There is still discrepancy over whether the storm should have been a named hurricane or not. In my personal opinion, if the credentials were there for a storm to be a hurricane (which they were) then it should be named and the proper warnings issued. The general public response is more sincere when hurricane and tropical storm warnings are issued, rather then if they are not. I do also disagree with the National Hurricane Center for not issuing Hurricane Warnings for Hurricane Sandy as well. However, we'll save that argument is for a different day.

One more day till Friday!!

Data and Image From:
NCDC.noaa.gov

Wednesday, November 14, 2012

Wacky Weather: Seeing Snow From Space

The Nor'easter that struck just a week after Hurricane Sandy slammed the east coast left a mark that you could see from space. Visible satellites don't always show just clouds, they can also show significant snow fall like in the picture shown below. This picture was taken on November 9th.

The white shown in New Jersey, Long Island and parts of Connecticut is snow on the ground.

So why does the happen you ask? Well, this picture was taken by a visible satellite. A visible satellite shows areas of white that reflect a large portion of the suns radiation. Because clouds and snow reflect a good majority of the sun's radiation they both show up on the visible satellite.

Hope this Brightens your Wednesday!

Photo From: 
Jeff Schmaltz, LANCE MODIS Rapid Response Team at NASA GSFC

Tuesday, November 13, 2012

Forecasting 101: First Steps

It's your first day on the job as a forecaster, so what are your first steps to making a wonderful forecast?
 
Answer: Gather the climate data and data from the day before.

Why?: It is very beneficial to know what the "average" temperatures are for that time of year in a particular city. Because the temperatures for the day your are forecasting for are likely to be around that number. Then, after you know the average temperatures you then gather what it was like the day before in that city. Most importantly a forecaster should see where the winds are coming from. I.E. if the winds are coming from the south, as a forecaster you should see what the weather was like south of you because that weather is more than likely working its way up to the city you are forecasting for.

Photo from:
meted.ucar.edu

Monday, November 12, 2012

Myth: Red Sky at Night Sailor's Delight

Myth: Red Sky at Night Sailors' Delight, Red Sky in Morning Sailors' Take Warning.


Result: This myth is actually 1/4 true.

The Science: The science behind this myth is quite simple.

Why the Sky is Blue: When the Sun's light enters the atmosphere the longer wavelength colors (red, orange, yellow, green) pass through, however the blue light (short wavelength) is absorbed by the atmosphere and radiated in all different directions. This is called Rayleigh Scattering and why the sky is blue. 

Why the Sky is Red: When the sun is lower on the horizon the light from the sun must travel further through the atmosphere causing more of the light to be scattered. Ultimately, causing the long wavelength colors to reach you making the horizon and sun to appear an array or red, orange and yellow. However, if there is a large cloud bank (that could be associated with a storm system), then the brilliant array of colors will not appear at sun rise or sun set, respectively.

Myth Debunked: Now that you understand why the sky changes colors. Also acknowledge that the sun rises in the east and sets in the west. The reason why this myth is one quarter true is because if a "Red Sky" at night this means there is not a large cloud bank to the west of the current position at that time. However, there could be a storm coming from the north, south, or east. In conclusion, this myth only rules out an impending storm from the west.

Hope this Brightens your Monday!


Resources:
Atmospheric Physics Class
Photo:
weathersavvy.com

Thursday, November 8, 2012

Throwback: Storm of the Century

For your first Throwback, I thought that I would go big with the March 1993 Storm.

Eleven tornadoes, center of low pressure of 966mb, winds measured over one hundred miles per hour, and a storm surge of twelve feet; are usually numbers associated with a hurricane. However, a strong March storm had all of these statistics and dropped over four feet of snow, as this 1993 storm made its place in the record books. 

The “Storm of the Century” is what most people call it. This incredible storm formed over Mexico and moved into the Gulf of Mexico in the second week of March in 1993. While turmoil was churning up in the Gulf of Mexico, a strong High pressure built into Mid-West during the same time bring brutal cold temperatures with it, spreading as far south as Alabama. Making for some prime conditions for a winter storm on the main land. 

As the storm strengthened in Gulf of Mexico it moved toward the Gulf Coast. It made land fall near New Orleans, LA. The storm then skirted across the southeast providing them with a mix of rain, sleet, and snow.

As the storm started to turn more northward the cold front associated with the low blasted the Florida peninsula. From this cold from the Florida peninsula experienced storm surges of twelve feet along the coast and a strong line of thunderstorms that produced some tornadoes. As the storm made an even strong pull to the north it began to wreak havoc on the southeast and had its sight set for the northeast, this can be seen in the low track below.


A strong upper-level jet kept this storm very strong as it progressed through its track. The entirety of the storm lasted about 48 hours. But the amount of snow it provided shut down most of the south and eastern seaboard for a couple of days. I posted a picture from the National Weather Service of the storm snow totals.
 
I actually did a case study on this storm in college. From a meteorological stand point this storm had all of the right things going for it to make it an epic strong storm. If you want more detail on the storm I have boat loads of information. Happy Thursday! 

Resources:
noaa.gov


Wednesday, November 7, 2012

Wacky Weather: 2nd Highest Tornado

For your first Wacky Weather, I am going to take you back to June of this year, on Mount Evans in Colorado as tornado touched down. Because a tornado touched down on top of Mount Evans, which is about 11,900 ft in elevation, it is estimated to be the 2nd highest tornado to touch down. The highest tornado ever recorded was in California over Rockwell Pass in 2004.

Above is a picture taken by Josh Deere, at the top of Mount Evans.

Mountain tornadoes are such a rarity because for one, people aren't always up there to see the tornado. Secondly, the terrain makes it hard for the atmosphere to have a large-scale weather system form. However, most importantly in high elevations there is less instability in the atmosphere, which is very important to produce tornadoes.

If we didn't have weird weather, then what would the Weather Channel report on. And more importantly what would I write about on Wednesday's? Wacky weather is why I chose meteorology in the first place, keeps me on my toes!

Resources:
ouramazingplanet.com


Tuesday, November 6, 2012

Forecasting 101: All Those Crazy Models

I'm sure your television meteorologist has said, "The models are showing that this storm will take this track." But what are these so called "Models" they speak of? Well, I am going to give you a brief over view of the two most common ones used and the one I love the most.

Models are one of the main forecasting tools that Meteorologist use when predicting the weather. Models are a tons of really complex equations that are computed by a super computer. These mathematical equations represent the physical characteristics of a weather system. Each model varies because the initial conditions are different from model to model. The model selects the initial conditions by breaking up the earth into a grid system both vertically and horizontally. This is why each model outputs slightly different results.

The first model I'm going to talk about is called the "Global Forecasting System" or commonly know as the GFS. The GFS is ran four times a day. The GFS is a medium range model because it forecast 16 days from the initial time. Even though it forecast 16 days into the future, it's reliability only is about 7 days from the initial time. The GFS is a good model. It usually goes heavy on precipitation, but overall is a good model.
../GemPakTier/MagGemPakImages/gfs/20121106/12/gfs_namer_129_200_wnd_ht_s.gif
Above, I posted a picture from the GFS model. It is the winds at the 200 mb level, which is about 40,000 feet above sea level. The areas which are colored in blue are areas of about 60 mph winds and higher. At this level is where you will find your Jet Stream.

The second most commonly used model is the North American Mesoscale Model, or as Meteorologist refer to as the NAM. Just like the GFS this model is run 4 times a day. However, the NAM only forecast three and a half days from the initial time. I think that the NAM does a fantastic job with precipitation. Mainly because it is a short term model. Below I posted another image.
../GemPakTier/MagGemPakImages/nam/20121106/12/nam_namer_006_precip_p06.gif
This image is from the NAM model. This is a precipitation forecast map. The areas shaded in green is where the model expects the to be rain falling over a 6 hour period and the amount that will fall. You might have noticed an excessive about of "H" and "L". I like to call it the model gets happy and puts a couple of extra High's and Low's symbols.
The last model I am going to mention, which is my personal favorite is the European Centre for Medium-Range Weather Forecast. On the forecast maps it is abbreviated as ECMWF, but most meteorologist just call it the EuropeanLike the GFS it is a medium range forecast model, providing data for 15 days from the initial time. However, unlike the GFS this model, the European is only ran twice a day. This is my favorite model because from all of my time as a forecaster, when the big storms are coming this model usually is the first to get the correct track of that particular storm.

Just to let you know of a little secret, almost all the tools meteorologist use to make their forecast can be found for free on multiple websites. I've one that I use a lot  is called E-Wall, it is from Penn State. http://www.meteo.psu.edu/~fxg1/ewall.html


Resources:
 http://www.research.noaa.gov/

Monday, November 5, 2012

A Little About Me and My Blog

Basically, I turned my biggest interest and hobby into my career. And I want to share my love for the weather with all of you. I want to cover all sorts of topics in the field. With that said I made up a schedule for me to follow. It is going to go as followed:

Monday: Myth Busting Monday's. Taking one myth at a time and seeing the science is behind each of them.
Tuesday: Forecasting 101. I'll tell you the basics about how you can forecast just like your TV Meteorologist.
Wednesday: Wacky Weather Wednesday's. I'll find the craziest weather stories and share them with you.
Thursday: Throwback Thursday's. Reaching through the past and bring up some old storms and weird phenomena.
Friday: Keeping Current Friday's. I'll keep you all updated with what's going on in the the Meteorological world with Climate forecast and Big Storm updates.

I'll try to keep it up as best as I can, but I hope you will tell me what day you like the best and I'll try to be sure to always update that day! WELCOME to my Meteorological Blog.