Note: All weather things are done on Coordinated Universal Time (UTC), Greenwich Mean Time GMT, or "Z" as most meteorologist refer it as. Basically it is just one more way from them to confuse you if you weren't already, with all of the other conversions. But you get used to it after a while.

All of the tiny symbols are current readings at that particular location. Most are located at airports. I found a great diagram of one from weatherwizkids.com. It breaks down what each element represents.
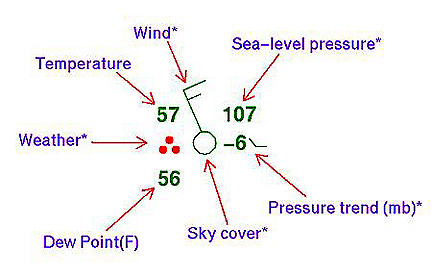
This example above is reading:
Sky Cover: Clear
Pressure: Is Falling and has fallen 6mb from previous reading
Sea-Level Pressure: 1010.7mb
Wind: North Northwest at 15 knots (approx 17mph)
Temp: 57 degrees Fahrenheit
Weather: Moderate Rain Fall
Dew Point: 56 degrees Fahreheit
So after decoding this is kind of a bad example, because you aren't going to have clear skies with moderate rain fall... but hopefully you catch the drift. I've linked up a helpful website I use if I ever have a question about symbols.
Weather Symbols Basics
All of these readings are super important to a forecaster, because you need to know what going on around you to understand what going to be heading your way. Any question please don't hesitate to ask!
Turkey Day is only two days away!!
Photo From:
weather.rap.ucar.edu
No comments:
Post a Comment